Kickout rate is the share of properties your AVM scores that get routed out of the automated path and sent to a human: an appraiser, a BPO agent, a desk review. The model doesn't reject these outright. It flags them, usually because the confidence score fell below the cutoff you've set, or because a hard-stop rule caught something (a property type outside your training distribution, a sale price that's wildly off the model value, missing data in a required field).
If you run performance monitoring on a production AVM, kickout rate sits next to hit rate and PSI as one of the numbers you pull every month. It's the one that maps most directly to cost, because every kickout is a manual order with a turn time attached to it, and a reviewer somewhere waiting on it.
Kickout rate vs. fallback rate
People use "kickout rate" and "AVM fallback to appraisal rate" almost interchangeably, but they're not always the same denominator. Kickout rate is usually measured against everything the AVM attempted to score. Fallback rate is sometimes scoped narrower, to a specific channel like a HELOC origination waterfall or a loan modification workflow, where the AVM is step one of a cascade and the appraisal is step two. If your QC team reports these two numbers differently and nobody can explain why, check the denominator first. That's the usual culprit.
Either way, both numbers are downstream of the same lever: your confidence score threshold.
Where the confidence score threshold comes in
Most AVMs attach a confidence score, sometimes a forecast standard deviation (FSD), to every value it returns. You set a cutoff. Below it, the value doesn't go out the door on its own; it gets kicked to a human. Raise the threshold and you catch more weak estimates, which lowers your error rate but raises kickout rate and cost. Lower it and you push more values through automated, which helps your unit economics until a bad one gets through on a loan that matters.
Tuning that threshold is a tradeoff exercise, not a one-time setting. Most teams review it quarterly against actual appraisal variance on the kicked-out population, to see whether the threshold is still doing its job or just adding friction.
What actually drives kickouts up
In practice, kickout rate doesn't spread evenly across your portfolio. It clusters. Rural parcels, properties with no recent comparable sales nearby, homes that have been renovated since the last tax assessment, and anything with an unusual lot configuration all tend to pull confidence scores down. So does a property sitting in a neighborhood with high price dispersion, where comps disagree with each other.
A good chunk of that clustering comes down to one thing: the model has no way to see the property. It has square footage, bed/bath counts, sale history, tax record fields. It has no signal on whether the house is well kept or falling apart, whether the lot backs onto a busy road or a greenbelt, whether three houses on the block have pools and this one doesn't. An appraiser walking the block picks that up in thirty seconds. A tabular AVM never gets the chance.
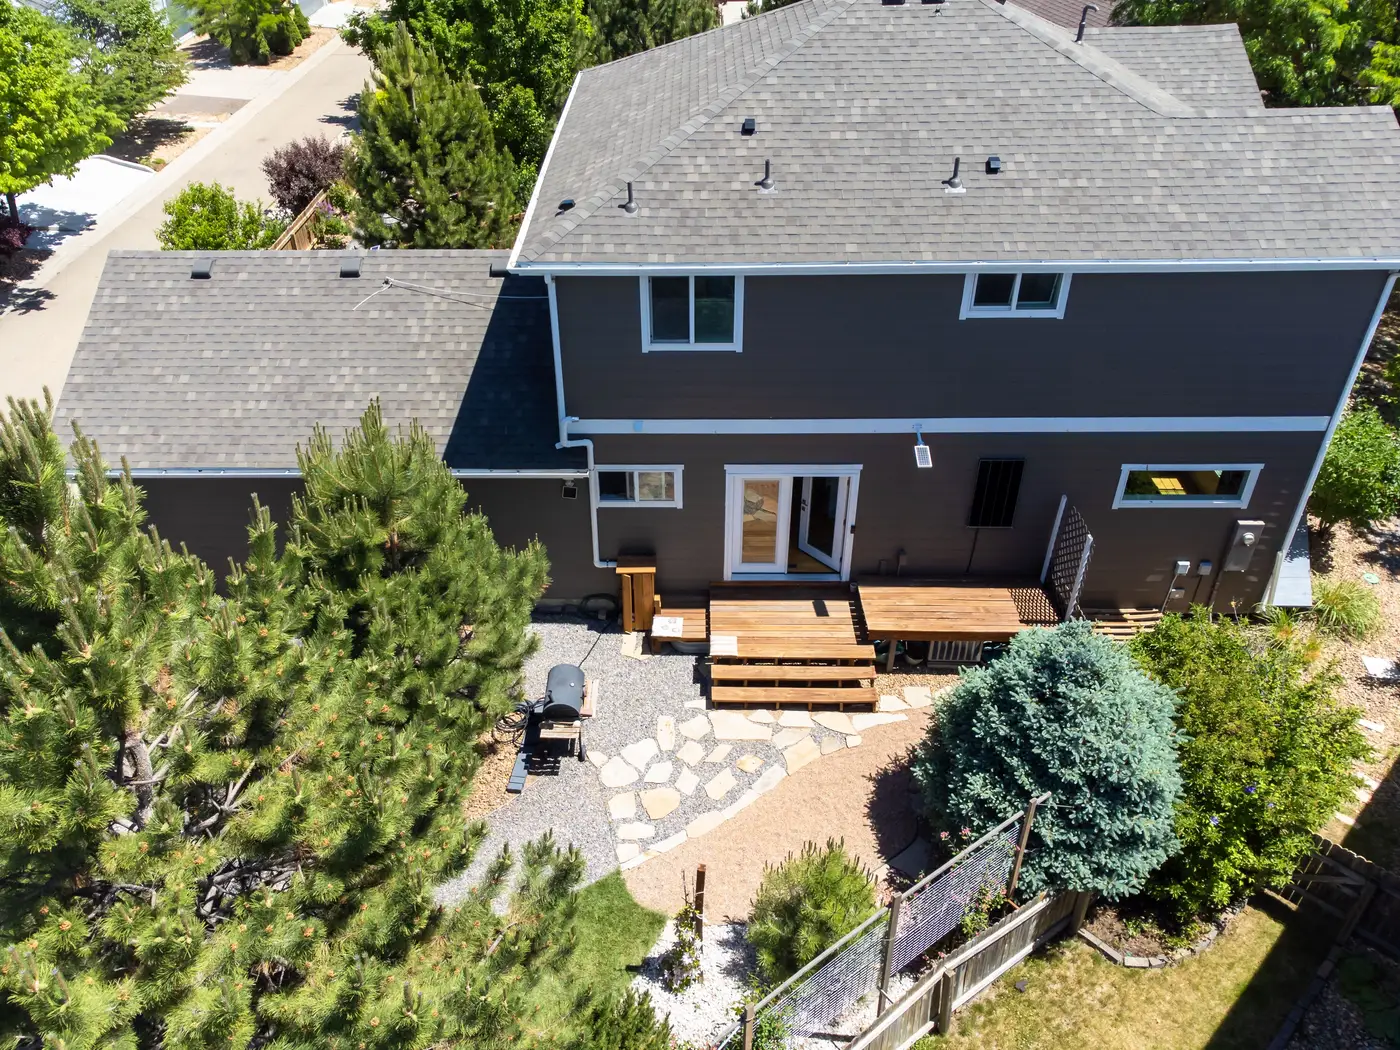
That gap is exactly what we built AVM Imagery to close: a learned embedding of the parcel and what's actually around it, from recent high-resolution imagery, delivered as a vector keyed to your property IDs so it drops in as another model input. It won't eliminate kickouts on properties that genuinely need a human look. But on the marginal cases where the only thing missing is "what does this place look like," it gives the model something to work with instead of a blank field.
If curb appeal and surrounding context are showing up as a blind spot in your kickout analysis, it's worth a look.