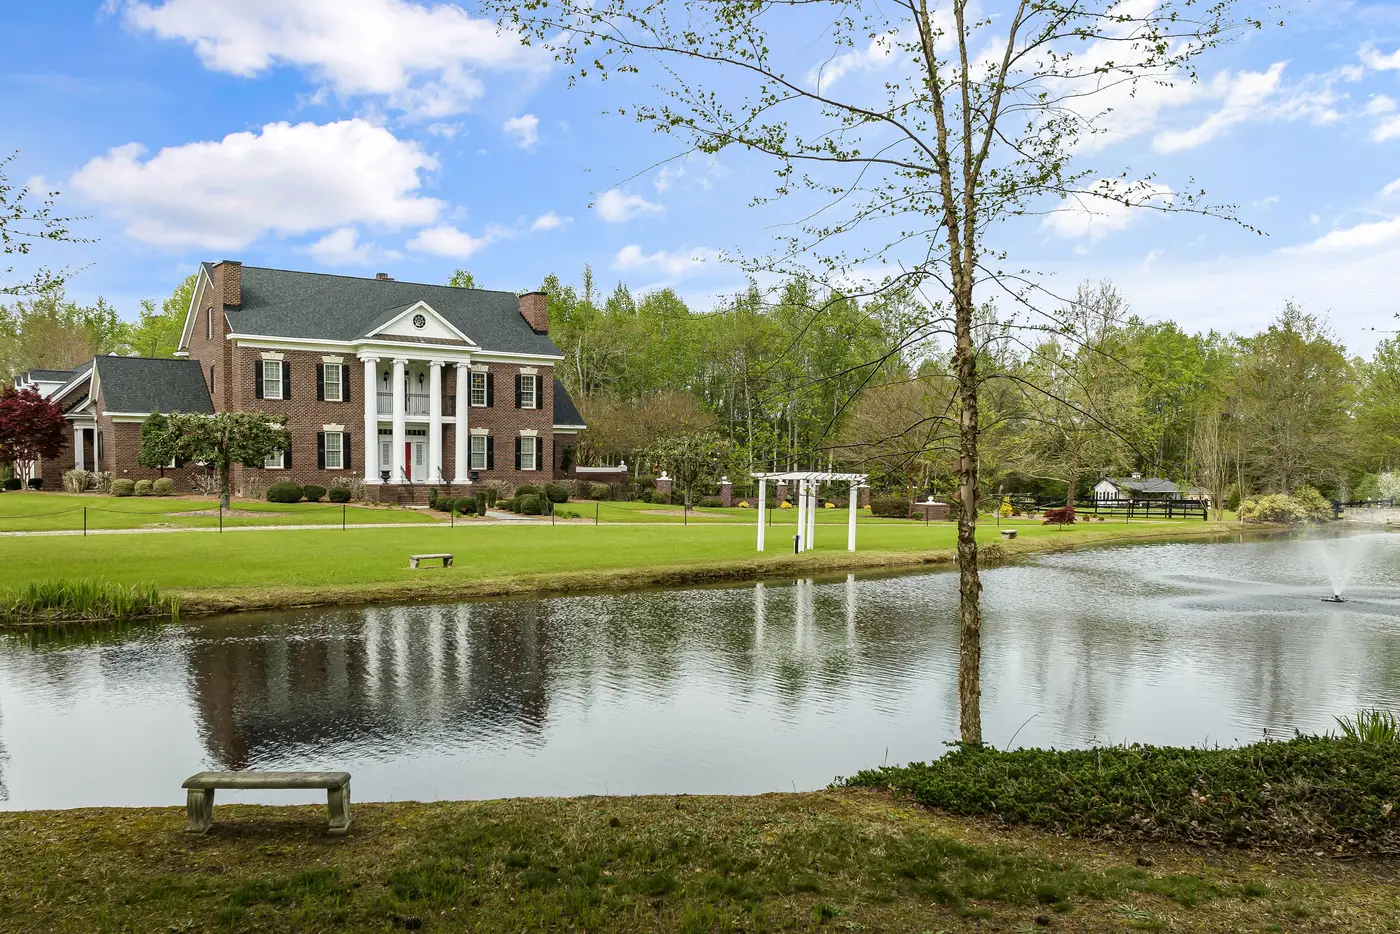
Forecast standard deviation is the number that tells a lender, or Fannie Mae's Collateral Underwriter, or your own risk team, how much to trust a given value estimate. It measures the spread the model expects for this property, based on how confident it is in the comps, the data density in that tract, and how volatile the local market has been. A tight FSD on a subject in a subdivision with forty recent same-model sales. A wide one on a one-off rural parcel with a pond and an outbuilding nobody can comp cleanly. The field exists because a single point estimate without a confidence band is close to useless for an underwriter deciding whether to waive an appraisal.
So when someone on your team proposes a new input, the question isn't "does this improve RMSE." It's whether FSD compresses on the properties where the model is currently least sure of itself, without quietly getting looser somewhere else to pay for it.
Why a new feature doesn't automatically tighten FSD
Most tabular features you'd add at this point, lot size variants, a different distance-decay on comps, a tax-assessment ratio, are already correlated with something the model has seen. They move PAD-10 a little, they shuffle feature importance, and FSD barely blinks because the underlying uncertainty about the property itself hasn't changed. The model already has plenty of square footage data; what it lacks is a read on what the house and the block look like relative to the comps being pulled.
That's the gap condition-adjustment grids and curb-appeal multipliers have patched by hand for decades, and it's exactly the kind of signal that doesn't live in any county record. A roof in visibly rough shape, a yard that's been let go, a block with three boarded-up houses on it, none of that shows up as a number anywhere upstream of the appraisal. If your new feature is going to move FSD, it needs to resolve uncertainty the existing feature set structurally can't touch, not restate something the model already has three proxies for.
Measuring lift without fooling yourself
Split your held-out set by current FSD band, not just by date or geography. Pull the subject properties your model already flags as low-confidence, high-FSD, and check whether the new feature narrows the band on that subset specifically. If it only tightens FSD on properties that were already tight, that's correlated noise rather than new information: a nice-looking average with no real change in the tail where appraisal waivers and risk flags actually live.
Worth watching for the failure mode that looks like success: FSD drops in aggregate because the feature is a decent linear proxy for sale price in dense suburban tracts, while it does nothing, or actively widens the band, on rural and low-comp-density parcels. Average FSD looks better. The problem the field exists to solve, knowing which values to trust less, hasn't moved.
Parcel-level imagery is one of the few inputs that targets the tail directly, because it reads condition and context on the specific property and its immediate surroundings rather than inferring it from assessor records three years stale. AVM Imagery packages that as a per-property vector keyed to your own record IDs, so it slots in as an additional feature rather than a rebuild of the pipeline, and you can run the exact holdout test above before deciding it earns a permanent place in the model.
If FSD on your low-confidence tail hasn't moved in a backtest in the last year or two, that's the segment worth testing a new feature against before anywhere else.
Worth a look at what a parcel-level imagery feature would do to your own holdout set before you decide it's not worth testing.